图表题必备词汇及9分模板
图表题分为以下几种,图表作文一般分3-4段。150-200字。
| 常用句 | ||
条形图(Bar Chart) | 第1段:The chart illustrates the...Units are measured in pounds sterling 第2段:Overall, most of.. on .. whereas the least amount of ...on..Furthermore, the most significant difference was on.. 第3段:In terms of..compared to(as opposed to). Similarly,..(around$3 and $6 respectively). 第4段: the other hand, |
|
| 表(table) | 第1段:The table illustrates... 第2段:Overall, 横比纵比, 找出最高最低项目。 注意:百分比格式(14%). 第3段:展开,列出具体数字。 compared to double, three times higher.. the lowest could be seen in category of in terms of as opposed to | |
线形图(line graph) | dip/a dip 波动 fluctuate/a fluctuation 稳定,持平 remain steady/unchanged/level off/constantly 峰值 rose dramatically to peak at..in 2008 peak at/reach a peak of hit a high of 低谷 hit a low of bottom out plateau similar trend at all times over the period given | |
饼图(pie chart) | ||
流程图(diagram or process) | ||
地图描述(map) | ||
综合题
| 第1段:1.The diagram illustrates..一句话主题. 2.Overall, 一句话整个过程及多图比较 第2段:1.In the first stage of..Initially, ... 2.and then...once, continues..from this point..At this stage of the process,. 第3段:Regarding..,ultimately |
举例,请背下来
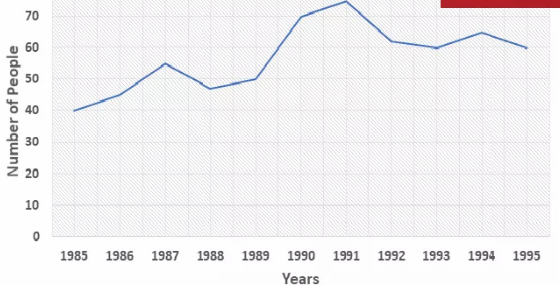
The number of reported case of LINE 1 began at 40 in 1985 after which the figure 上升 steadily to reach about 55 in 1987. In 1988, there was 下降 in the number to below 50 before 上升 to reach a 峰值 approximately 75 in 1991. After that date, the figure dropped to about 55 in the final year.
rose=increased=climbed=grew=went up
a fall=a steadily decline=a drop=a dip=a decrease
climbing=increasing=rising=going up=growing
peak of