饼图-范文01
The pie charts below show the comparison of different kinds of energy production of France in two years.
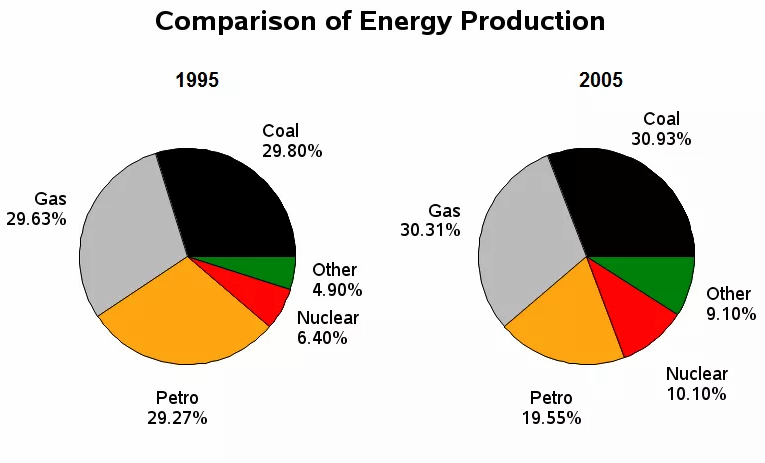
The two pie charts illustrate the proportion of five types of energy production in France in 1995 and 2005.(两个年份在一起,可以省略一个in)
Overall, in both years, the most significant sources of energy were gas and coal, which together accounted for over half the production of energy, while nuclear and other kinds of energy sources generated the least amount of energy in France. In all types of energy production there was only minimal change over the 10 year period.
Energy produced by coal comprised 包含 of 29.80% in the first year and this showed only a very slight increase of about a mere 1% to 30.9% in 2005. Likewise (同理), in 1995, gas generated 29.63% which rose marginally(微小增长) to 30.1% 10 years later.
With regards to the remaining methods of producing energy, there was an approximate 5% growth in production from both nuclear power and other sources to 10.10% and 9.10% respectively(这个词前面没有逗号). Petrol, on the other hand, was the only source of energy which decreased in production from 29.27% in 1995 to around a fifth(19.55%) in 2005.
饼图要点:
1. 描述最大和最小比例部分。It is clear that ____represents the largest portion of _____, whereas _____ is undoubtedly the smallest.
2. 如果有不同时期的两个图,要对比,强调变化。
3.描述饼图的词汇 account for/comprises of/represents。
(If the percentage is around 60%) – Nearly a third…
(If the percentage is around 52%) – Over a half of
(If the percentage is around 25%) Roughly a quarter of respondents
A small fraction…
| Written form | Percentage | Fraction |
| a half | 50% | 1/2 |
| a third | 33% | 1/3 |
| two thirds | 66% | 2/3 |
| three quarters | 75% | 3/4 |
| a quarter | 25% | 1/4 |
4.Units are measured in...前文没有提到单位的话,要加上这句话解释计量单位。